Performance Hub – HP4U Report
The Homepage for You tab within the Performance Hub dashboard provides a uniquely valuable report on an ongoing A/B test that’s used to continually and accurately measure the impact of including personalization on your homepage.
Let’s first understand the two variants that are being compared:
Curated: This is a 10% segment of your homepage audience that acts as a control variant. Readers in this group see the homepage with no personalized recommendations, so every reader should see the exact same mix of articles in the same positions. Essentially, this should be a representation of how your homepage was configured before HP4U was implemented.
Personalized: This is a 10% segment of your homepage audience that has HP4U enabled. Since HP4U will generally not be powering every article slot on the homepage, this variant reflects whatever configuration your site has established for the personalization.
Many of the metrics on the HP4U tab are measured in uplifts comparing the performance of the Personalized variant vs the performance of the Curated variant. For example, if the Personalized variant drove 100 PVs and the Curated variant drove 50 PVs, then the uplift would be 100%.
Before diving into the specific metrics, there are two additional points to consider.
- Daily Report Timing: This is not a real-time dashboard; HP4U reports run at approximately noon ET to calculate the previous day’s metrics for all active publishers. Depending on your timezone, there will be a 1.5- to 2.5-day delay before you can view today’s metrics.
- Sample Size/Date Range Selector: HP4U data will be very noisy on a day-to-day basis, as it can be heavily impacted by news cycles and audience fluctuations. The more Homepage Sessions per variant, the more reliable your data will be. While you may start to spot trends when sessions per variant are in the 25k–50k range, you should aim for a date selection that gives you upwards of 100,000 sessions per variant for statistically significant results. Depending on the size of your homepage audience, this may require 3 days of data or 3 months.
With this framework in mind, let’s explore the individual metrics reported.
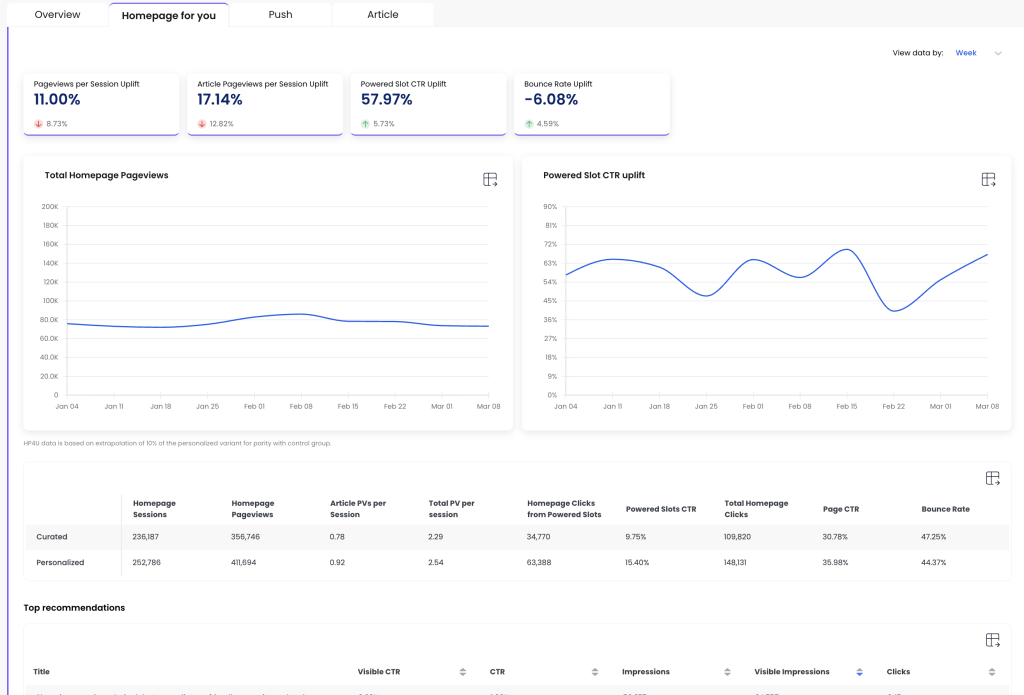
Top Line Metrics
Pageviews per Session Uplift: The percent increase in the average number of pageviews per session for the Personalized variant compared to the Curated variant. This is calculated from the Total PVs per Session rows in the Curated/Personalized table shown lower on the Performance Hub page.
Article Pageviews Per Session Uplift: The percent increase in the average number of article pageviews per session for the Personalized variant. A major goal of the homepage is typically to help readers find interesting articles, so this metric shows the impact of personalized article recommendations.
Powered Slot CTR Uplift: A “powered slot” is any article slot on the page that’s marked as personalized. This metric looks at the aggregated Click-Through Rate (CTR) for all those article slots and compares them to the same grouping of article slots on the control variant, where readers see static, non-personalized article recommendations.
Bounce Rate Uplift: A bounce is counted when a reader leaves the site and the homepage was the only page viewed in their session. A lower homepage bounce rate indicates that readers are finding content to engage with. Unlike other engagement metrics, a lower Bounce Rate is preferred, so we report a positive uplift if the Bounce Rate decreases on the Personalized variant.
Additional Metrics
Below the two graphs, there are several additional important datapoints.
Homepage Sessions: This is the amount of sessions generated by each 10% reader segment. These should typically be pretty close to equal, but over time personalization may drive an uptick in return frequency so often the Personalized variant gains an edge in sessions generated.
Homepage Pageviews: Similar to sessions, but this measures each time a reader viewed the homepage. Many sessions include multiple homepage PVs so this number will almost always be larger than the session totals.
Article PVs Per Session: These are the raw averages that are used to calculate the Article Pageviews Per Session Uplift discussed above in the top-line metrics.
Total PVs Per Session: These are the raw averages that are used to calculate the Pageviews Per Session Uplift discussed above in the top-line metrics.
Homepage Clicks from Powered Slots: Aggregated click totals for all slots that are marked as Personalized. For the Curated (control) variant, we aggregate clicks from the exact same grouping of article slots to provide an apples-to-apples comparison of raw clicks on slots with personalization versus the same slots without it.
Powered Slots CTR: The formula for this CTR is (Homepage Clicks from Powered Slots / Homepage Pageviews) * 100. These are the rates used to calculate the Powered Slot CTR Uplift discussed above in the top-line metrics.
Total Homepage Clicks: All clicks on editorial homepage slots, including both personalized and non-personalized article slots. This does not include clicks on ancillary elements such as ad modules, video players, navigation bars, and subscribe buttons.
Page CTR: The formula for this CTR is (Total Homepage Clicks / Homepage Pageviews) * 100. This is a crucial metric that helps you ensure the personalization is not just cannibalizing clicks from other regions, but rather driving a substantially improved UX that holistically improves reader engagement.
Bounce Rate: These are the rates used to calculate the Bounce Rate Uplift discussed above in the top-line metrics.
Top Recommendations
If personalization is the engine that’s driving the uplifts described above, the “recommendations” (aka your articles) are the fuel for this engine. The article level engagement shown in the Top Recommendations list is a gold mine of insights on how your most loyal readers are responding to your journalism on the homepage.
One crucial distinction is that this data is aggregated for all personalized recommendations, not just the 10% audience segment that’s measured in the Personalized variant. If you have 90% or even 100% of your homepage traffic being impacted by HP4U, then the engagement behavior for all of those readers will be included.
Here are the definitions of the specific metrics that are included:
Visible CTR: (Clicks on the article while in personalized slots / visible impressions for the article while in personalized slots) * 100
CTR: (Clicks on the article while in personalized slots / impressions for the article while in personalized slots) * 100
Impressions: A count of times the article was included in the personalized slots during a page view. An impression is registered whether or not the reader scrolled the page to where the article was located.
Visible Impressions: A count of times the article was included in the personalized slots and visible in the reader’s viewport during the page view.
Clicks: A count of times the reader clicked the article when it appeared in the personalized slots.