Engagement Score
What Is An Engagement Score?
Page views don’t tell the whole story of article performance. Content needs to both grab the reader and hold their attention. If you’re just measuring the number of page views, you may be missing out on other factors which are keeping your readers engaged on your site. This is where an article’s Engagement Score comes in – it will let you know what happens beyond the click, so you can understand the quality of traffic on your site.
The Engagement Score allows you to pinpoint winners and articles that might need some improvements to keep readers engaged.
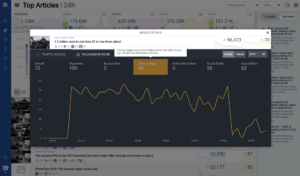
Across the Newsroom dashboards, when you click on an article you are able to see specific information for that article. For example, when you are in the Alerts Dashboard or the Overview Dashboard, you are able to see article specific details. This includes an Engagement Score. This article will review why Engagement Score is so important and how this metric is calculated.
What metrics are included in the Engagement Score?
The Engagement Score takes the following six metrics into consideration:
- Page Views – number of times article is viewed
- Bounce Rate – percent of page views for this article where this is the last page a visitor views
- Time on Page – average amount of time visitors spend on the article
- Video Watch Rate – percent of page views for this article where the visitor watched the video for 30 seconds or more
- Social Traffic – percentage of traffic from social sites
- Search Traffic – percentage of traffic from search sites
- Conversion Rate – amount of conversions to paid subscribers for this article (for publishers with conversion tracking enabled)
How Are Engagement Scores Calculated?
The “score” for each article compares the metrics for this article to the top 150 articles that are currently getting traffic. It’s a score out of 100 – if an article has a score of 48, this means it’s performing better than 48% of your other articles.
What is the overall Engagement Score?
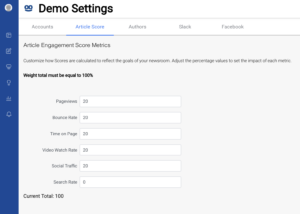
The overall engagement score incorporates the six engagement metrics into one score. Your Admin or Newsroom Engagement manager can customize how the six metrics add up to the overall score for each publisher. By default, we use the first five metrics evenly:
You can customize the weighting of each metric to meet your unique editorial and business goals. Reach out to your Newsroom engagement manger, or newsroom-support@taboola.com to configure.
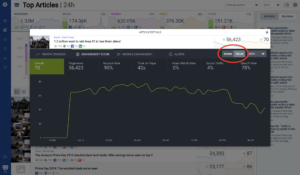
Toggling between Score and Value
In the Article detail view, you can click the slider to show Value instead of Score for these metrics:
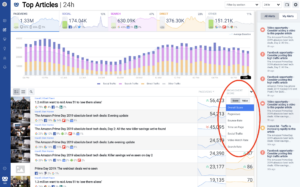
On the main Top Articles Dashboard, you can choose to show data for the overall score, or a value/score for each of the metics included. Once you’ve selected something, you can click the gray “Engagement Score” column header to sort the dashboard by your selected score or metric.