Front Page Dashboard
The Front Page dashboard is where you can monitor your homepage (or other landing page) performance – by position and overall – and find A/B testing tools. This dashboard gives you a detailed view of the articles you feature on your homepage and tracks their performance in real time. With the A/B testing tools, you can run tests to see which images or alternate headlines drive more engagement for specific articles.
In this article, you’ll find more about the features of the Front Page Dashboard and how they can help you optimize your homepage performance.
Don’t have access to the Front Page Dashboard? Please reach out to newsroom-help@taboola.com to discuss.
Front Page Performance Overview
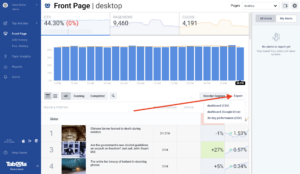
The Front Page tab gives an overview of what’s happening on your homepage. At the top, you will see top level numbers for CTR, page views and clicks on your homepage in the last hour. If your site is using separate dashboards for mobile and desktop, or are monitoring more than your homepage, you can use the dropdown on the upper right corner of the dashboard to select the dashboard you want view or run A/B tests on.
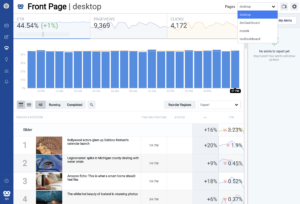
Placement Performance
Below the bar graph, you will find performance by placement or group of placements on your homepage. This is also where you can view the status of A/B Tests for specific placements (more on A/B Tests later in this article).
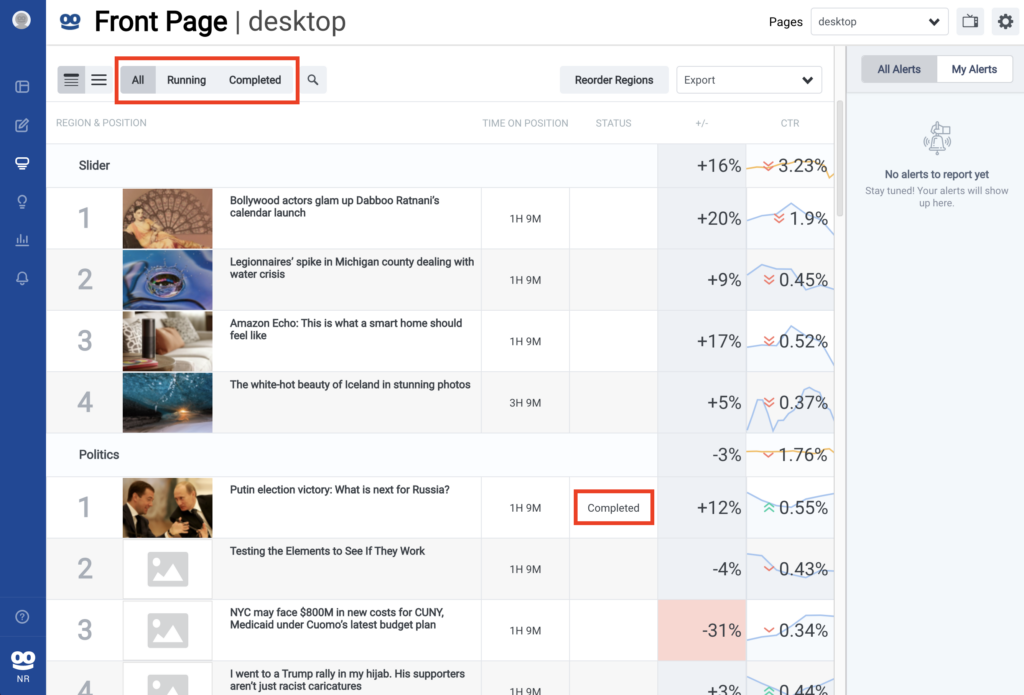
At the top of the list, you can toggle between two options:
- Grouped (default) – Next to each region name (“Slider”, below), you’ll see the performance for that region as a whole. Each line below represents a position in that region, and you can see performance for each position.
- Ungrouped – you can switch to this to see each position without grouping by region.
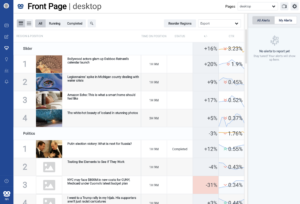
In each view, you will see the following information:
- Article Info – This shows you the headline and image of the current item in this position.
- Time on Position – This shows how long the content item has been in the current position.
- Status – This shows the status of any A/B test for this article on this position.
- Relative Performance – This shows you how the article is performing in its current position, compared to a four-week baseline of the same position at the same time and day.
- CTR (click-through-rate) – This is the click through rate of the listed story in this position for the last hour.
Running an A/B Test
Within the Front Page Dashboard, you are able to run A/B tests for any article to see which headline and image will get the highest CTR. In this section, we’ll review how to run an A/B test.
In order to set up an A/B test, take the following steps:
- Select an article for which you’d like to run an A/B test
- Click on the row of that specific article, opening up a panel
- Click Setup A/B Test
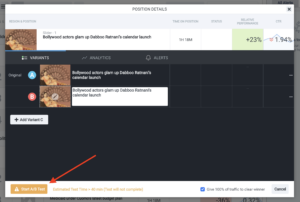
- Change the headline and/or the thumbnail for testing. You can can create up to 5 variants by clicking + Add Variant
- The A/B test will run until there is enough data to declare a winner, we determine it’s a tie, or until the 40 minute time limit for tests. The results will show in the Front Page dashboard, and you can find the data on the A/B History tab if the story has moved.
Only sites with a certain amount of traffic will be able to use the A/B testing features. We recommend at least 3M homepage pageviews monthly. The testing interface will estimate how long it will take to run the test.
Exporting Data
You can use the “Export” button to export Front Page data. You can export live data for all positions to CSV or Google Drive, and you can export performance for each position over the last 30 days to CSV.
A/B History Report
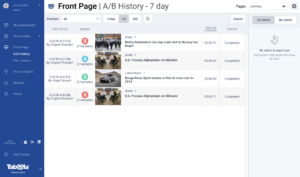
You can check the A/B test results and history by taking the following steps:
- Go to the A/B History tab under Front Page
- Select the correct dashboard, and position you want to see (or “All”)
- Click on any test to see all variants and the outcome.
- You can use the outcome of the tests to inform your titles and images moving forward.
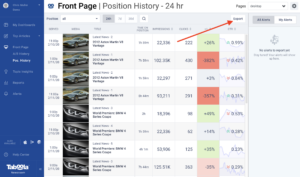
Position History Report
You can use this dashboard to see all of the articles that have been in a specific position and the articles’ performance.
You can also use the “Export” button to download a CSV that contains all of the stories that have been on any position in the last 24 hours. You can use this to see where a particular story has been featured, and that story’s performance in each position.